Google Analytics may appear to be a jumble of data, graphs, and numbers if you aren’t familiar with the program and how to break it down. If you try to take in all the information at once, of course you’re going to get a little lost! Fortunately, it is actually pretty easy to understand and grab information from once you learn how to navigate the program. With a few helpful tips you will be able to decode your analytics in no time. So, here’s a beginner’s guide to decoding your business’s Google Analytics.
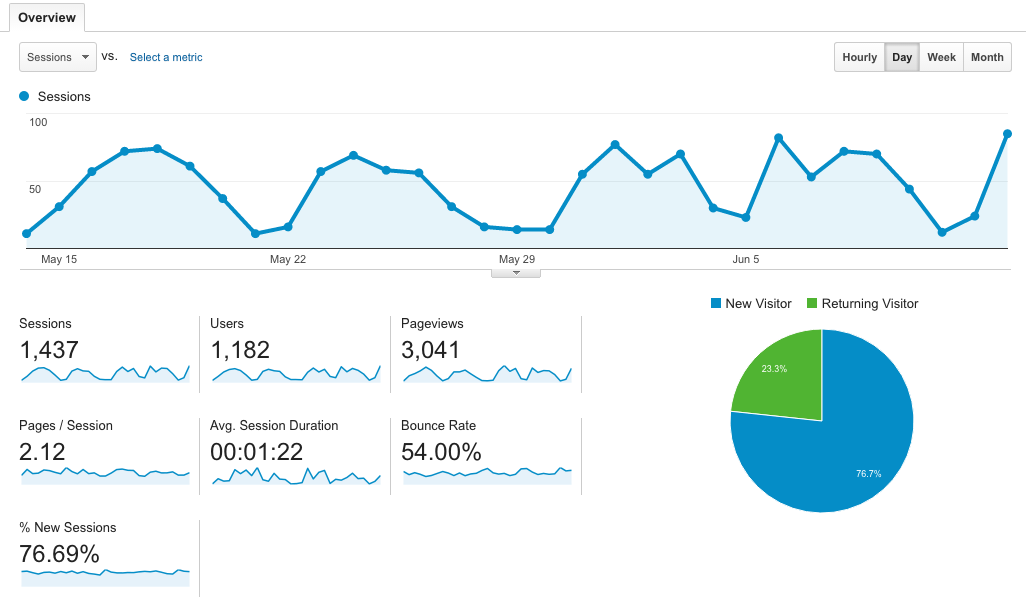
On the left side of the screen, there is a list of tabs. Simply click ‘Audience’ and then ‘Overview’. This section is responsible for relaying how many people are visiting your site and how long they’re staying. You should see something similar to the picture above
So, what does all of this information mean? Here’s a quick breakdown:
Sessions:
Sessions simply means a period of time a user spent on your page. If I visit your page, my time on your website would be counted as 1 session. Google’s tracker resets a session after 30 minutes of inactivity. So, I can visit your page 5 different times in one day and account for 5 sessions.
Users:
You may be curious why the number of users is lower than the number of sessions. Users are only counted once—even if they visit your page numerous times on different days and account for multiple sessions. So, 1 user can give you 20 sessions.
Pageviews:
Most websites have more than a single page. So, if I visit your website and click your homepage, then your about us page, then your contact page, that would count as 3 page views. Just as a sum up—I would be counted as 1 user, 1 session, and 3 page views for this visit. It’s making sense, right?
Pages/Sessions:
This one is super simple. This is the average number of pages a user viewed per session on your website. According to the image above, users typically visited 2.12 pages while on their website.
Avg. Session Duration:
Again, super straight forward. The average time users spent on their website was 1 minute and 22 seconds.
Bounce Rate:
A bounce rate is the percent of users that only visited one page on your website and didn’t interact with anything. So, if I visited your website and immediately left without clicking another page, that would be considered a bounce.
% of New Sessions:
This is the estimated percentage of new users on your website. Pretty straight forward.
Moving along, on the left side of the page click ‘Acquisition’ and then ‘Overview’. This section allows you to determine how people are getting to your website. You should see something similar to the image below.
Organic Search:
This is the number of times someone found your page from searching relevant terms online. For example, if I googled ‘summer clothes’ and I clicked Forever21’s website from the results page, that would count as an organic search.
Direct:
Super simple, this is the number of times someone typed in your url and went directly to your page.
Paid Search:
This is the number of times a user clicked your website url from one of your paid efforts. For example, if you had a paid google ad and someone clicked it—that would count under paid search.
Referral:
This is the number of times a user clicked a link to your website from another source. For example, if I was reading a blog about summer clothes on a fashion blogger’s page and clicked a link to Forever21 within the blog—that would count as a referral.
Social:
This is the number of times someone went to your website from social media. For example, if someone clicked your website link from a post on your Facebook—that would count as a social media point.
Take it step by step when deciphering your Google Analytics in order to avoid overwhelming yourself. This online analytics tool has endless data that you can discover, but as for now you’re on your way to decoding the beginning steps of your Google Analytics. It’s important to understand how many people are visiting your site, how long they’re staying, and where they’re coming from. Use this new information to alter your marketing strategy accordingly!


